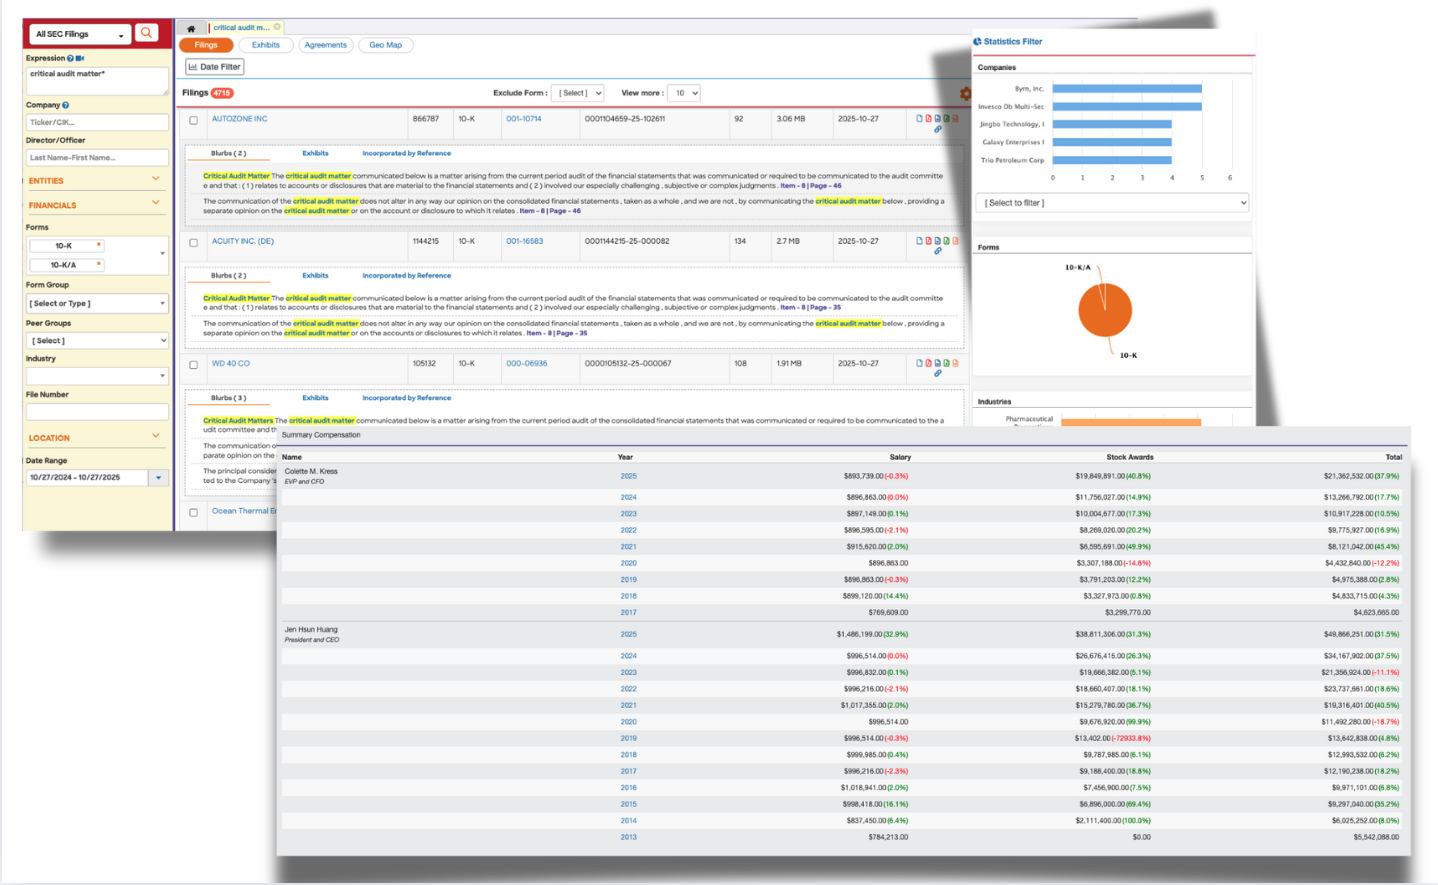
Research Tool
Advanced SEC filing research with interactive filtering and comprehensive data analysis. Access decades of financial data with precision search capabilities and dynamic infographic filters.
- Advanced text search across all SEC filings
- Interactive data visualization and charting
- Custom filtering and sorting options
- Export capabilities for detailed analysis
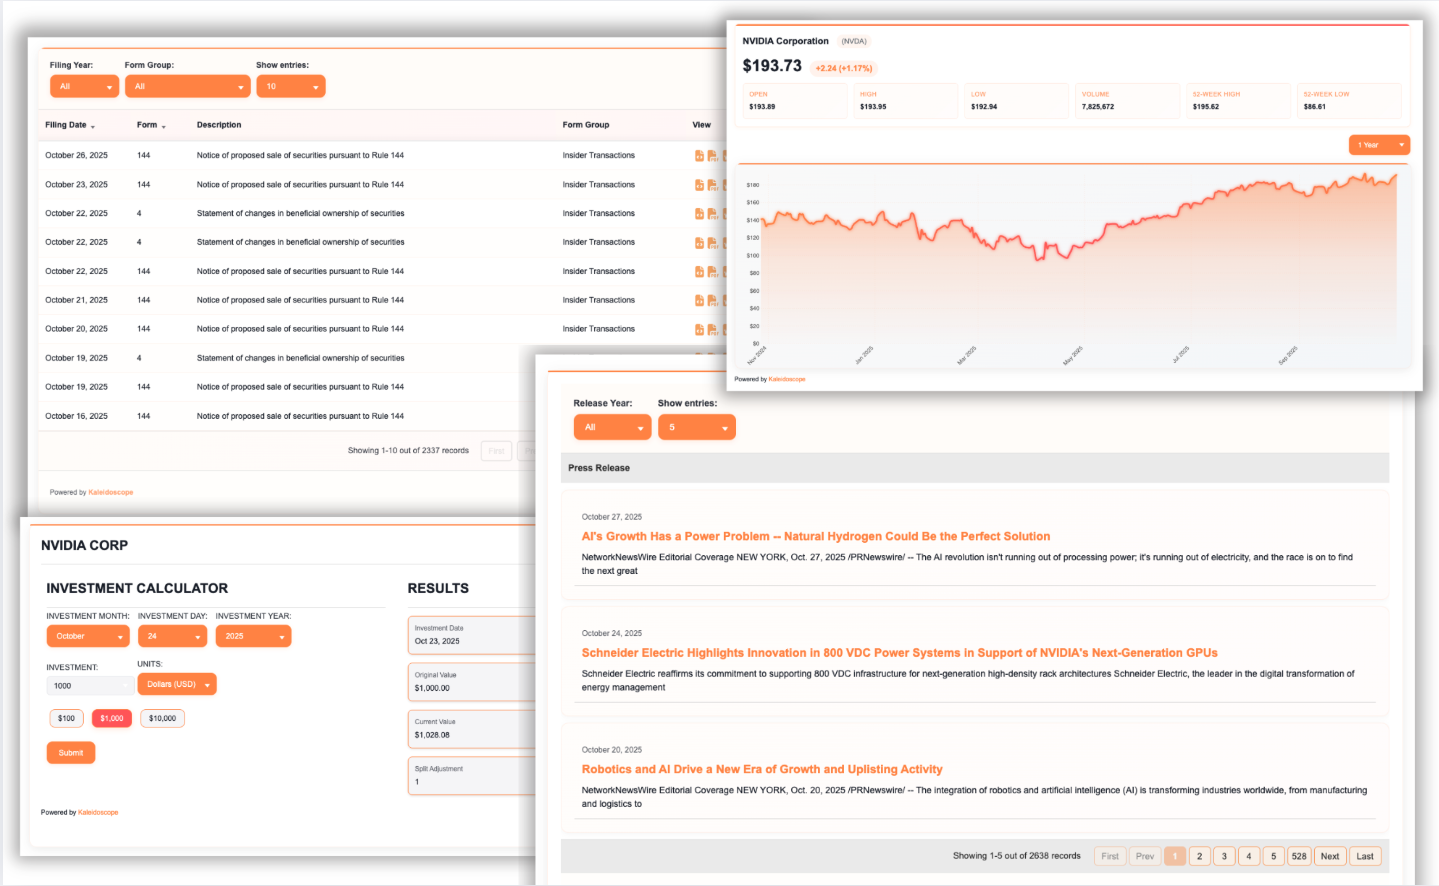
Investor Relations
Complete compliance widget solutions for your IR pages. Automated SEC filings display, stock data integration, and press release management to keep your stakeholders informed.
- Automated SEC filings widgets for compliance
- Real-time stock data integration
- Press releases and news management
- Customizable investor tools and calendars
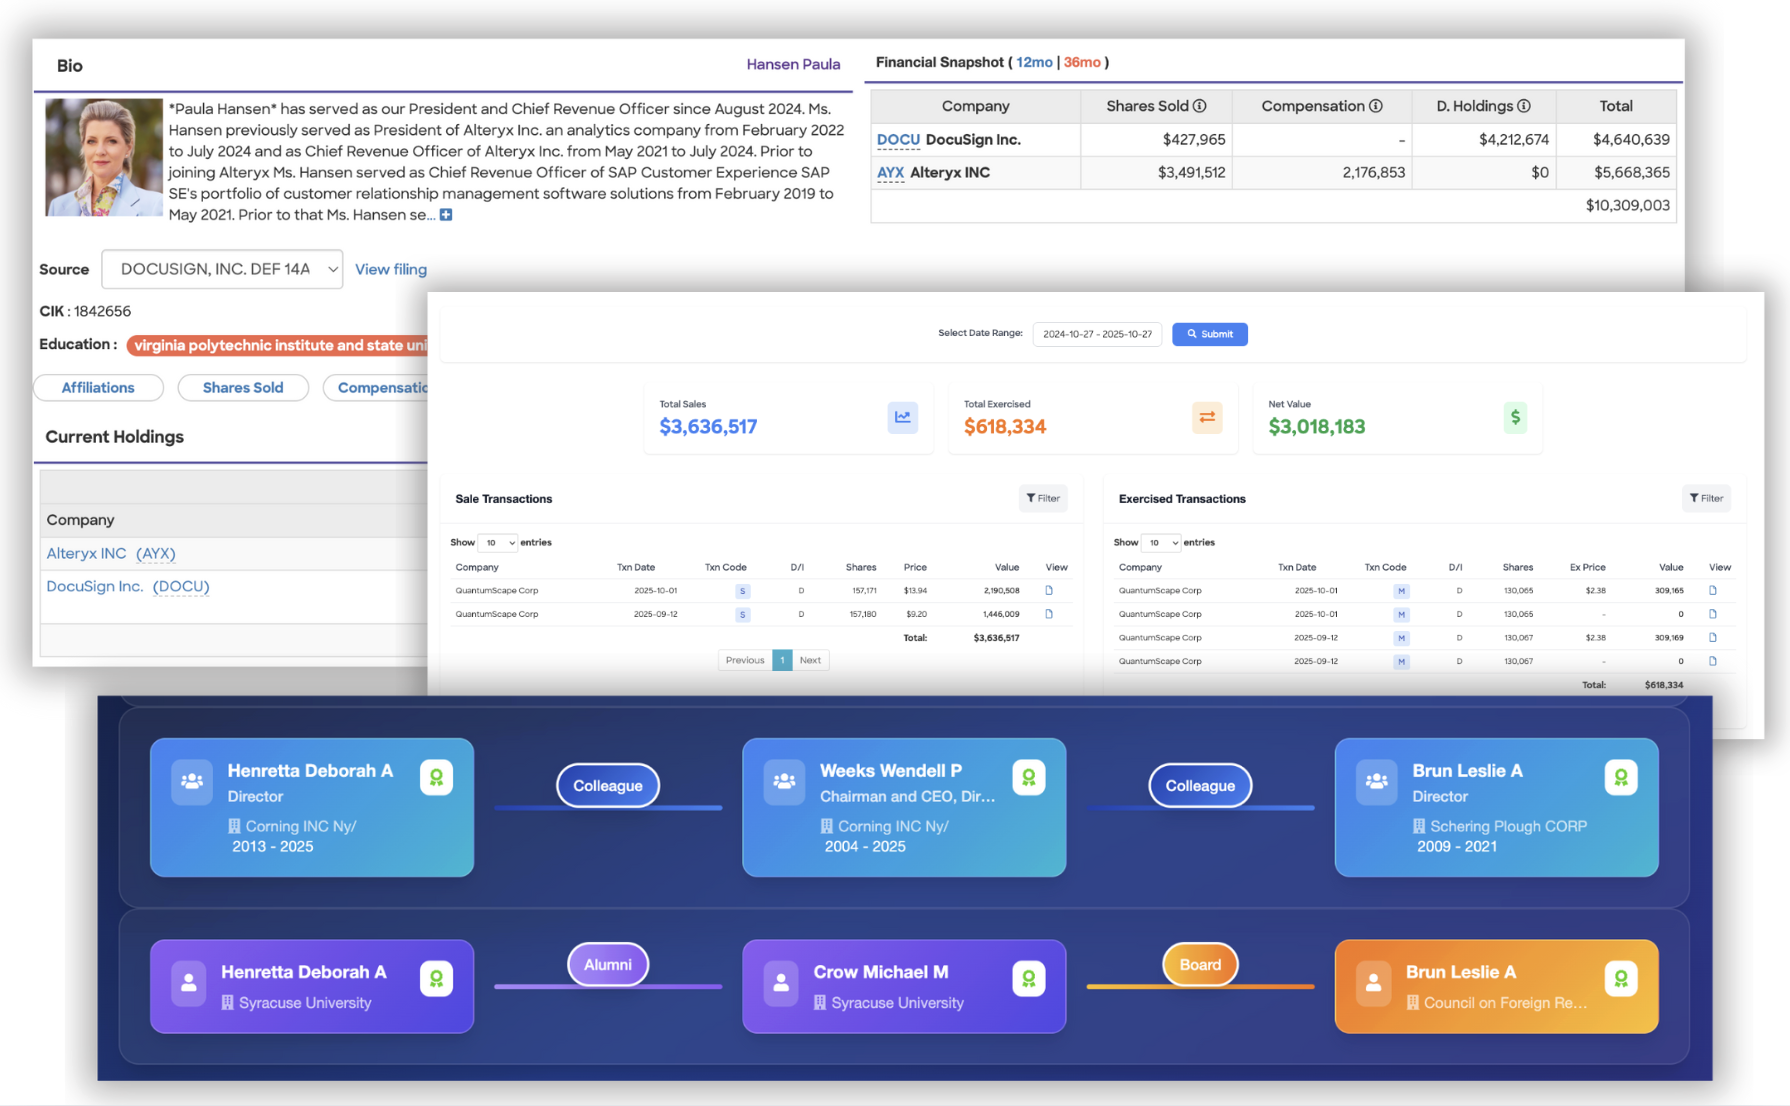
Insider Focus
Comprehensive insider transaction analysis for prospect research. Surfaced and summarized insider wealth and relationship details save time and provide actionable insights for your research.
- Insider transaction tracking and analysis
- Wealth and relationship mapping
- Prospect research automation
- Executive compensation insights
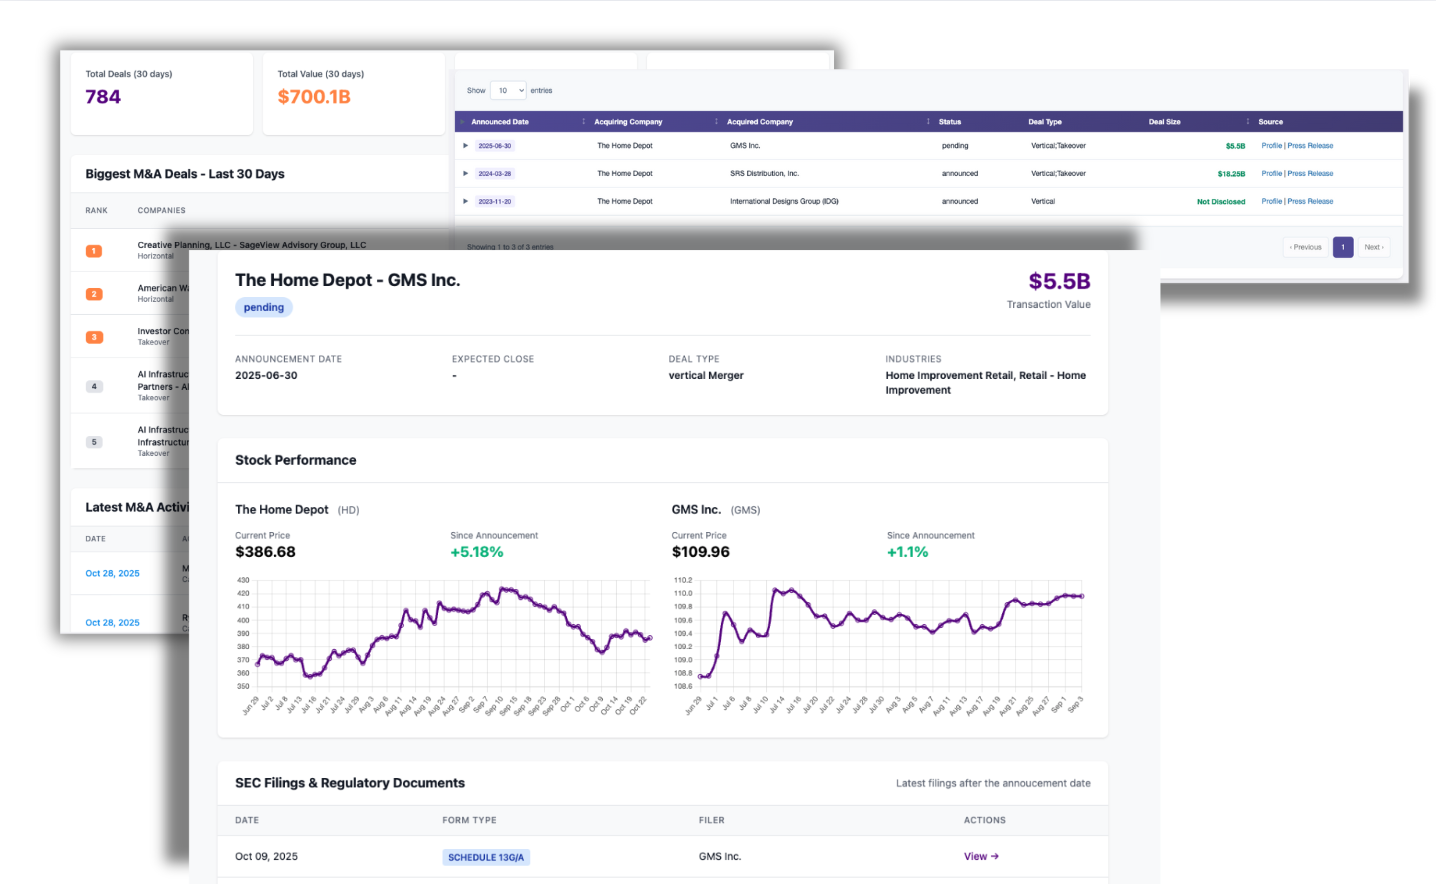
M&A Intelligence
Track mergers, acquisitions, and strategic transactions in real-time. Comprehensive M&A data sourced from press releases and verified against SEC filings to identify public company involvement.
- Real-time M&A deal tracking
- Automatic matching with SEC filings
- Deal analytics and valuation metrics
- Industry trend analysis and reporting
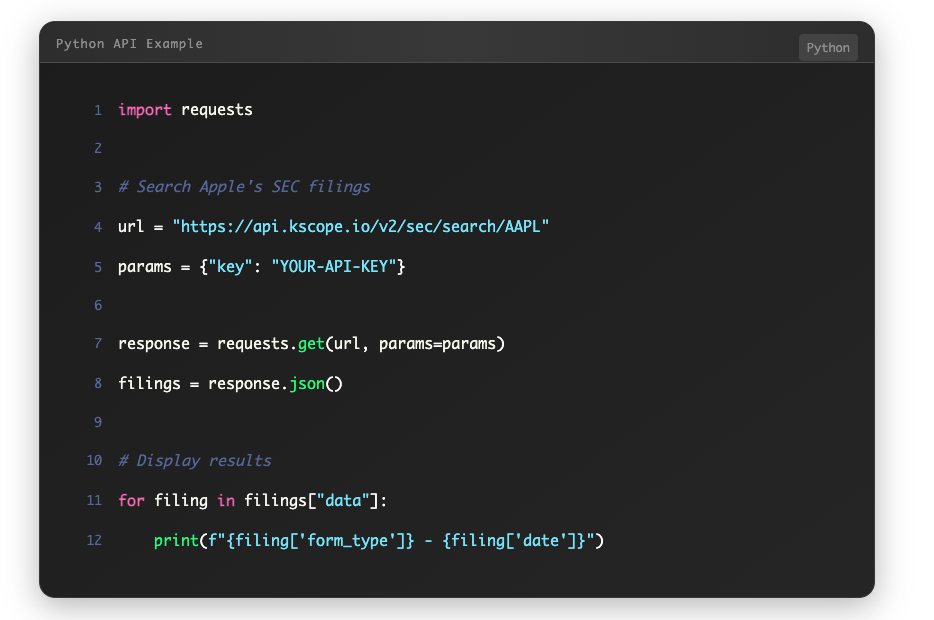
API Platform
Robust REST APIs with comprehensive documentation and real-time data feeds. Build powerful financial applications with our scalable infrastructure and enterprise-grade reliability.
- RESTful API with JSON responses
- Real-time data streaming capabilities
- Comprehensive SDK and documentation
- Enterprise-grade security and reliability